Strategy Overview
- Invests primarily in large-capitalization equities utilizing an absolute return based framework
- Comprised of 30-40 holdings with low average turnover since inception of 26.0%
- Focused on large, high quality businesses with sustainable earnings growth and conservative balance sheets
Source: Morningstar Direct℠ as of March 31, 2026
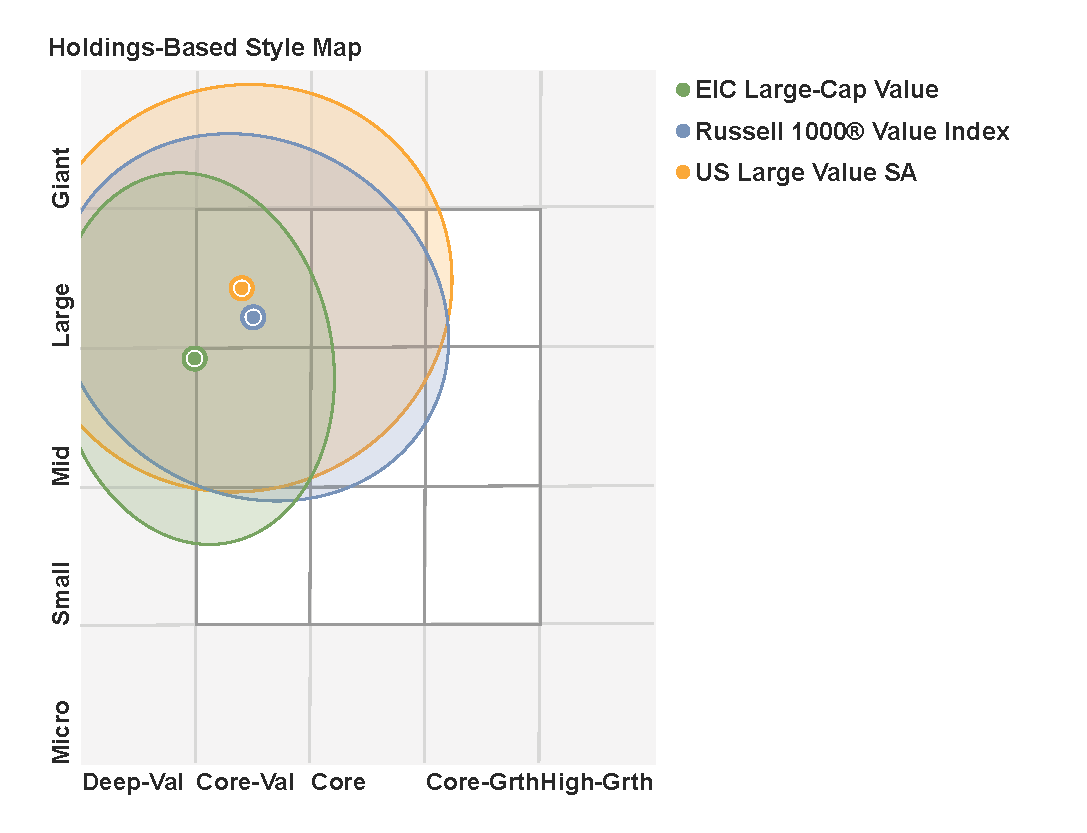
Characteristics
| Market Cap (Wtd Avg) | Market Cap (Median) | Price/Earnings Ratio (TTM) | Price/Book Ratio | Current Yield | Return on Equity | Active Share | |
| EIC Large-Cap Value | $78.9B | $45.9B | 15.2x | 1.9x | 3.5% | 16.3% | 94.5% |
| Russell 1000® Value Index | $371.2B | $14.8B | 22.2x | 2.6x | 1.9% | 12.3% | – |
Performance
| Large-Cap SMA (Gross*) |
Large-Cap SMA (Net*) |
Russell 1000® Value Index |
|
| 1 year | 11.0% | 7.7% | 15.9% |
| 3 years | 15.0% | 11.6% | 14.3% |
| 5 years | 12.1% | 8.8% | 9.4% |
| 10 years | 12.1% | 8.8% | 10.6% |
| Since Inception | 9.9% | 6.7% | 7.7% |
as of 3/31/2026
*EIC results are those of its Large-Cap Value SMA Composite. Gross returns for the composite are “pure” gross returns and do not reflect the deduction of any expenses, including trading costs, and are presented as supplemental information to a GIPS® Composite Report, which can be found below. Net returns are calculated by reducing gross returns with an assumed maximum annual SMA fee of 3.0% (which is assumed to be equal to or higher than the highest actual SMA fee charged by a program sponsor), applied monthly. LCV strategy inception: January 1, 2001. Indexes are unmanaged, do not incur management fees, costs and expenses, and cannot be invested in directly. All returns include reinvestment of dividends and interest. Performance data is historical. Past performance does not guarantee future results. Current performance may be lower or higher than the performance quoted. Investing involves risk including possible loss of principal.
Portfolio data is from a representative Large-Cap Value account and is presented as supplemental to a GIPS® Composite Report that is considered an integral part of the above presentation. Individual portfolio characteristics may vary from that of the representative portfolio. All characteristics are calculated on a gross basis. All characteristics except for Weighted Average Market Capitalization, Current Yield, Active Share and Annual Turnover are median values. Current Yield is the weighted average of each stock’s current yield. Current Yield of a stock is the annual dividend per share divided by price per share. Price/Earnings Ratio shows the multiple of earnings at which a stock sells as determined by the ratio of the company’s most recent month-end share price to the company’s earnings per share for the trailing twelve months (TTM). Price/Book ratio shows a company’s most recent month-end share price to the company’s book value per share for the trailing twelve months. Book value is the total assets of a company, less total liabilities. Return on Equity is the percentage a company earns on shareholder’s equity. Net income divided by average shareholder’s equity indicates how effectively management has invested shareholder’s equity. Active Share measures the percentage of holdings in a representative Large-Cap Value portfolio that differ from the benchmark holdings either in name or weight on March 31, 2026. Annual Turnover represents the average percentage of a representative portfolio’s holdings that have changed annually since the strategy’s inception.
Russell Index information is from S&P Capital IQ PRO. London Stock Exchange Group plc (“LSE Group”) is the source and owner of FTSE Russell index data. FTSE Russell is a trading name of certain of the LSE Group companies. “Russell®” is a trade mark of the relevant LSE Group companies and is used by any other LSE Group company under license. All rights in the FTSE Russell indexes or data vest in the relevant LSE Group company which owns the index or the data. Neither LSE Group nor its licensors accept any liability for any errors or omissions in the indexes or data and no party may rely on any indexes or data contained in this communication. No further distribution of data from the LSE Group is permitted without the relevant LSE Group company’s express written consent. The LSE Group does not promote, sponsor or endorse the content of this communication.